A few years into working alongside people who restore mangroves, count trees, and try to prove that a degraded hillside is coming back to life, I noticed something uncomfortable. The hardest part of their work was almost never the ecology. It was the paperwork of proof.
Digital Measurement, Reporting and Verification — dMRV — is supposed to be the backbone of that proof. It is how a carbon or biodiversity project says, credibly and repeatedly, here is what changed, here is how we measured it, here is the evidence anyone can audit. Get it right and capital flows to real outcomes. Get it wrong and the whole market loses its legitimacy.
So I went looking for the tools. What I found was not a system. It was a pile of tools, leaning against each other, hoping no one pushed too hard.
The stack I inherited
Let me describe the workflow honestly, because if you have lived it, you will recognise every step — and if you haven't, you should see what we are asking the people protecting nature to endure.
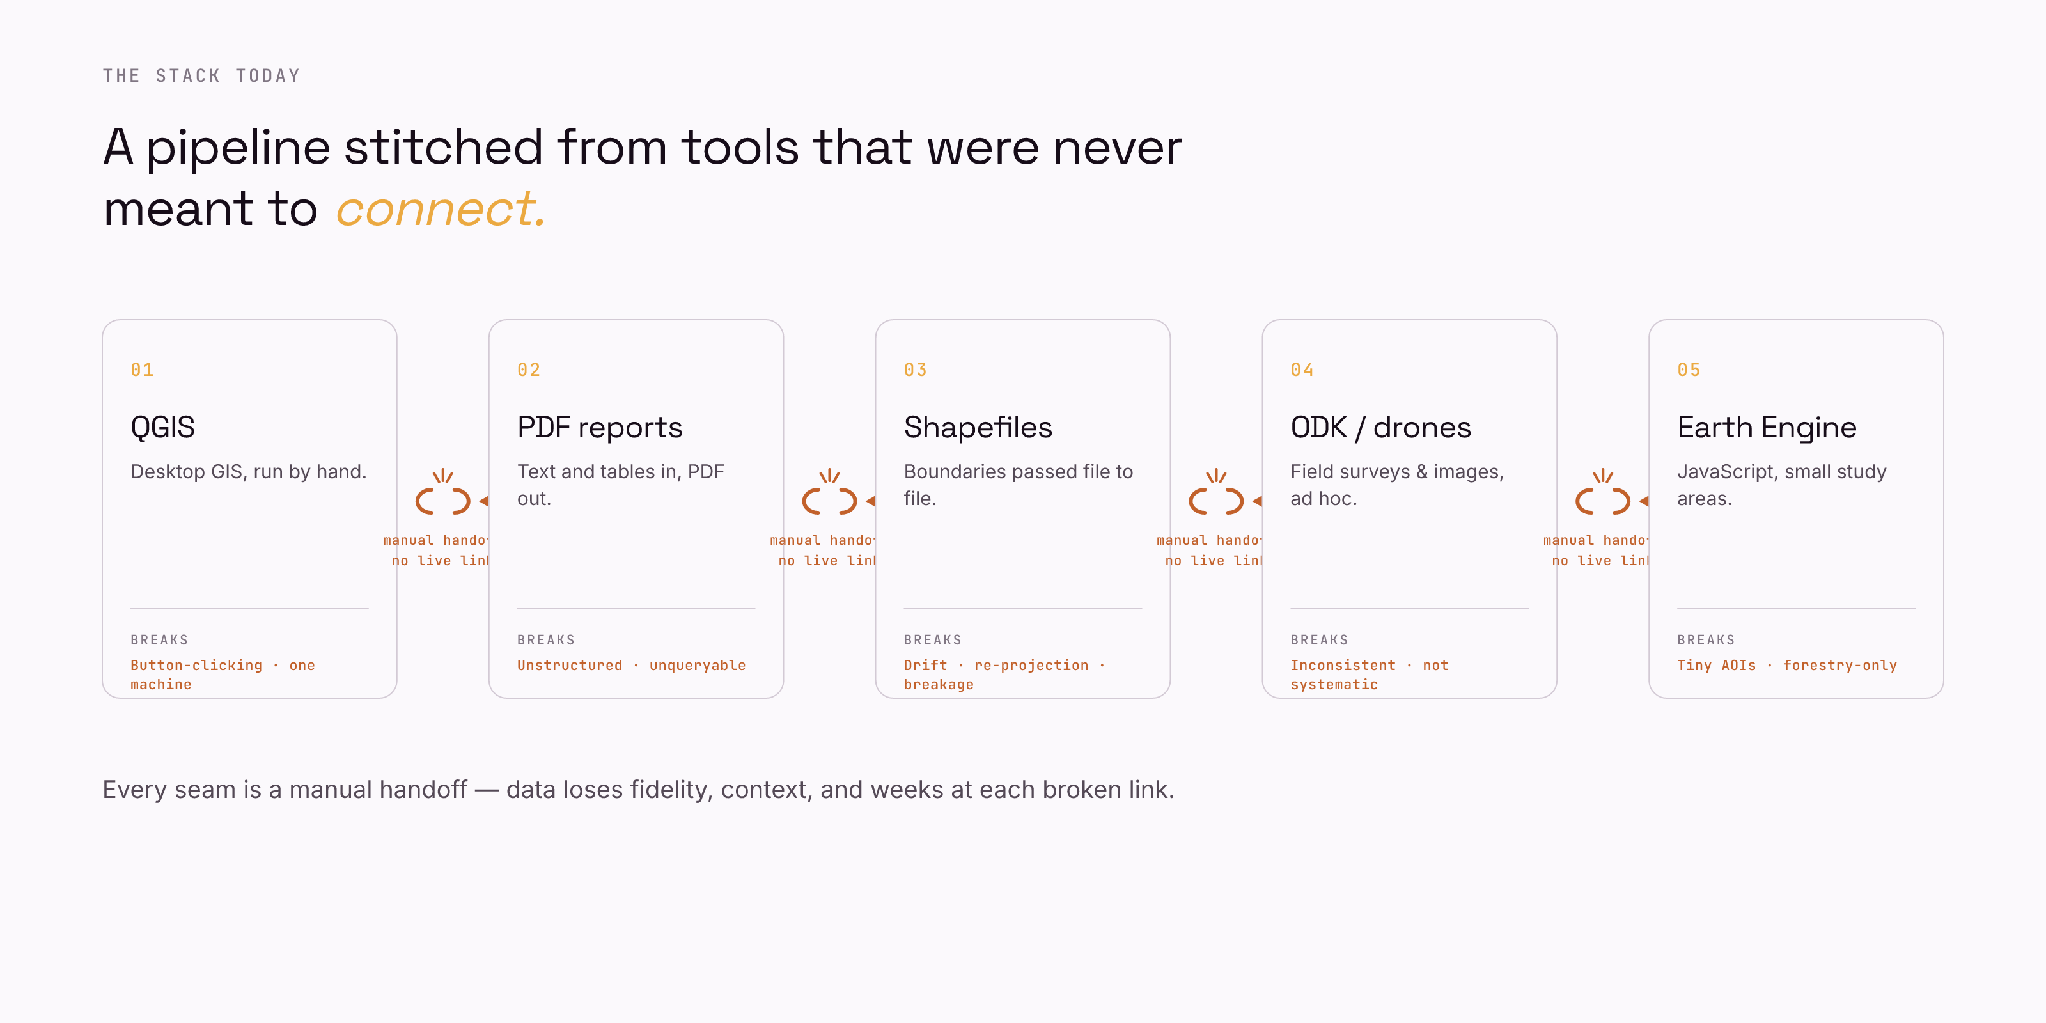
Figure 1 — The stack today: a pipeline stitched from tools that were never meant to connect.
It usually starts in QGIS. Wonderful software, genuinely. But the work is button-clicking on one person's laptop — a sequence of manual operations that lives in their head and dies when they leave. Nothing about it scales, and nothing about it repeats the same way twice.
The outputs become PDFs. Methodologies arrive as PDFs. Reports leave as PDFs. Somewhere in between, numbers that were briefly structured get flattened into prose and tables that no machine can read back. We took data, turned it into a document, and called it a record.
Boundaries move around as shapefiles — emailed, re-projected, edited, re-saved — and quietly drift out of alignment until two maps of the same forest no longer agree on where the forest is.
Field data, when it exists at all, comes from ODK forms or a folder of drone images — collected sincerely, but rarely systematically. One team's survey is not another's. One flight's imagery is not comparable to the next.
And the more sophisticated teams reach for Google Earth Engine, writing JavaScript against a planetary archive. It is the closest thing to magic in the list. But it strains the moment you push past a small area of interest, the templates assume you are doing forestry, and the knowledge lives with the one engineer who can write the script.
Every arrow between those tools is a manual handoff. And every handoff is where fidelity, context, and weeks of someone's life quietly leak out. The frustrating part isn't any single tool. It is the seams between them. This is not a digital system. It is a relay race run by exhausted people carrying buckets of water that spill a little at every exchange.
I am not alone in this. The honest assessment from inside the industry is the same: "PDF files, spreadsheets, and hand-based measurements remain the core tools for measuring and verifying forest carbon credits." Traditional MRV is "resource-intensive, costly, and slow," and biodiversity MRV is more scattered still.
What we are actually asking for
Here is the thing about the people on the other end of this. A mangrove does not wait for your data pipeline to mature. A peatland does not pause its degradation while you reconcile two shapefiles. The Kunming–Montreal Global Biodiversity Framework set twenty-three targets for 2030; frameworks like TNFD, CSRD and the EU Deforestation Regulation now expect measurable, auditable disclosure of how organisations depend on and affect nature. The obligation has already shifted from ambition to evidence.
What it means is brutally simple: we are being asked to monitor vast, fragmented, constantly changing ecosystems — credibly, repeatedly, and on a reporting cadence — with tools that cannot talk to each other.
So before naming any solution, let me describe the shape of the thing that should exist. Not a product. A shape.
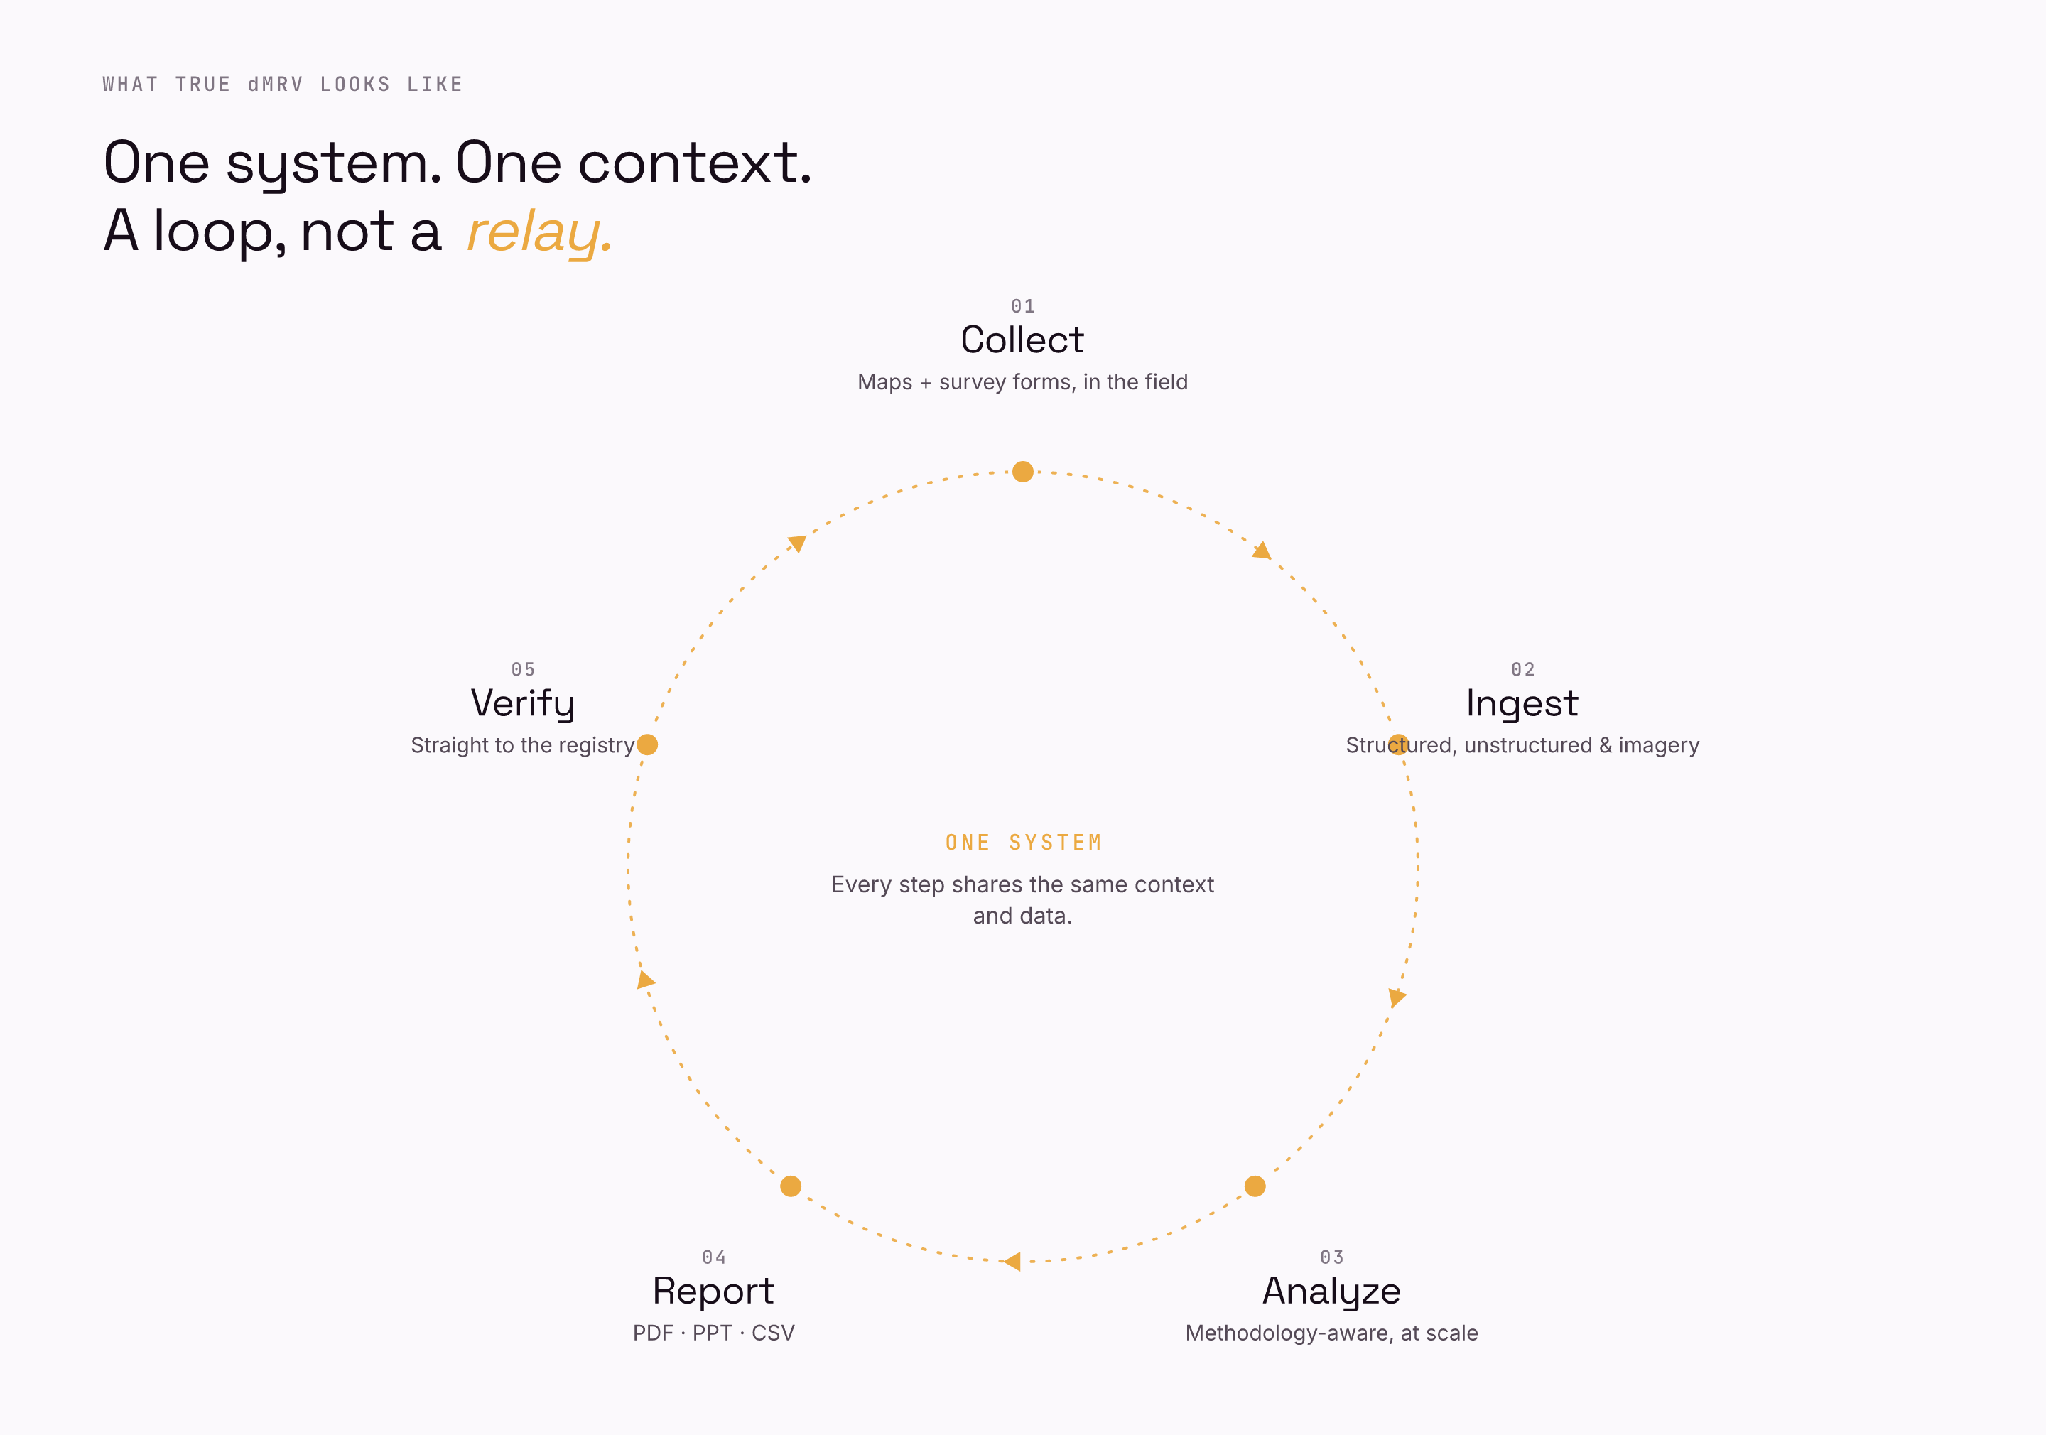
Figure 2 — What true dMRV looks like: one system, one context, a loop not a relay.
True dMRV is one system, not a stack. The same context carries from the first field observation to the final line item the registry sees. Nothing is re-keyed. Nothing is exported and re-imported and prayed over.
It begins with collection it controls. It should generate the basemaps and the survey forms the field team uses, so that what comes back is structured the same way every time, by every enumerator, on every visit. Collection and analysis cannot be two different worlds.
It is omnivorous about data. Structured tables, unstructured documents, satellite and drone imagery — the messy reality of a real project — should all be first-class inputs, not problems to be cleaned by hand for a week before the work begins.
It understands the methodology, not just the math. The rules that govern whether a credit is real live in dense, hundred-page documents. A true system reads them completely, applies them consistently, and never quietly skips the inconvenient equation at two in the morning.
It reports in the registry's language. The output is not "data we will later format." It is the report, the deck, the table — built to be submitted, closing the loop straight back into the next monitoring cycle.
Notice what this is: a loop, not a relay. Collection feeds analysis, analysis feeds reporting, reporting feeds verification, verification feeds the next round of collection — and the context never leaves the system.
For years, this shape was a wish. The tools to build it — foundation models that can read a document and reason, geospatial AI that understands real coordinates, cheap and frequent satellite imagery — simply were not good enough yet. We described the system we wanted on whiteboards and then went back to clicking buttons in QGIS.
That has changed.
The system, finally
I am going to be careful here, because I have spent this whole essay earning the right to name something, and I would rather under-claim than oversell. We are early. In February 2026, the world's largest carbon program approved its first credits under a digital-MRV pilot — a pilot, not a market-wide shift. Nobody has finished this. The verifier still verifies; the ecologist still knows things the model does not.
But for the first time, I am working with a system that has the shape I described — and that is new.
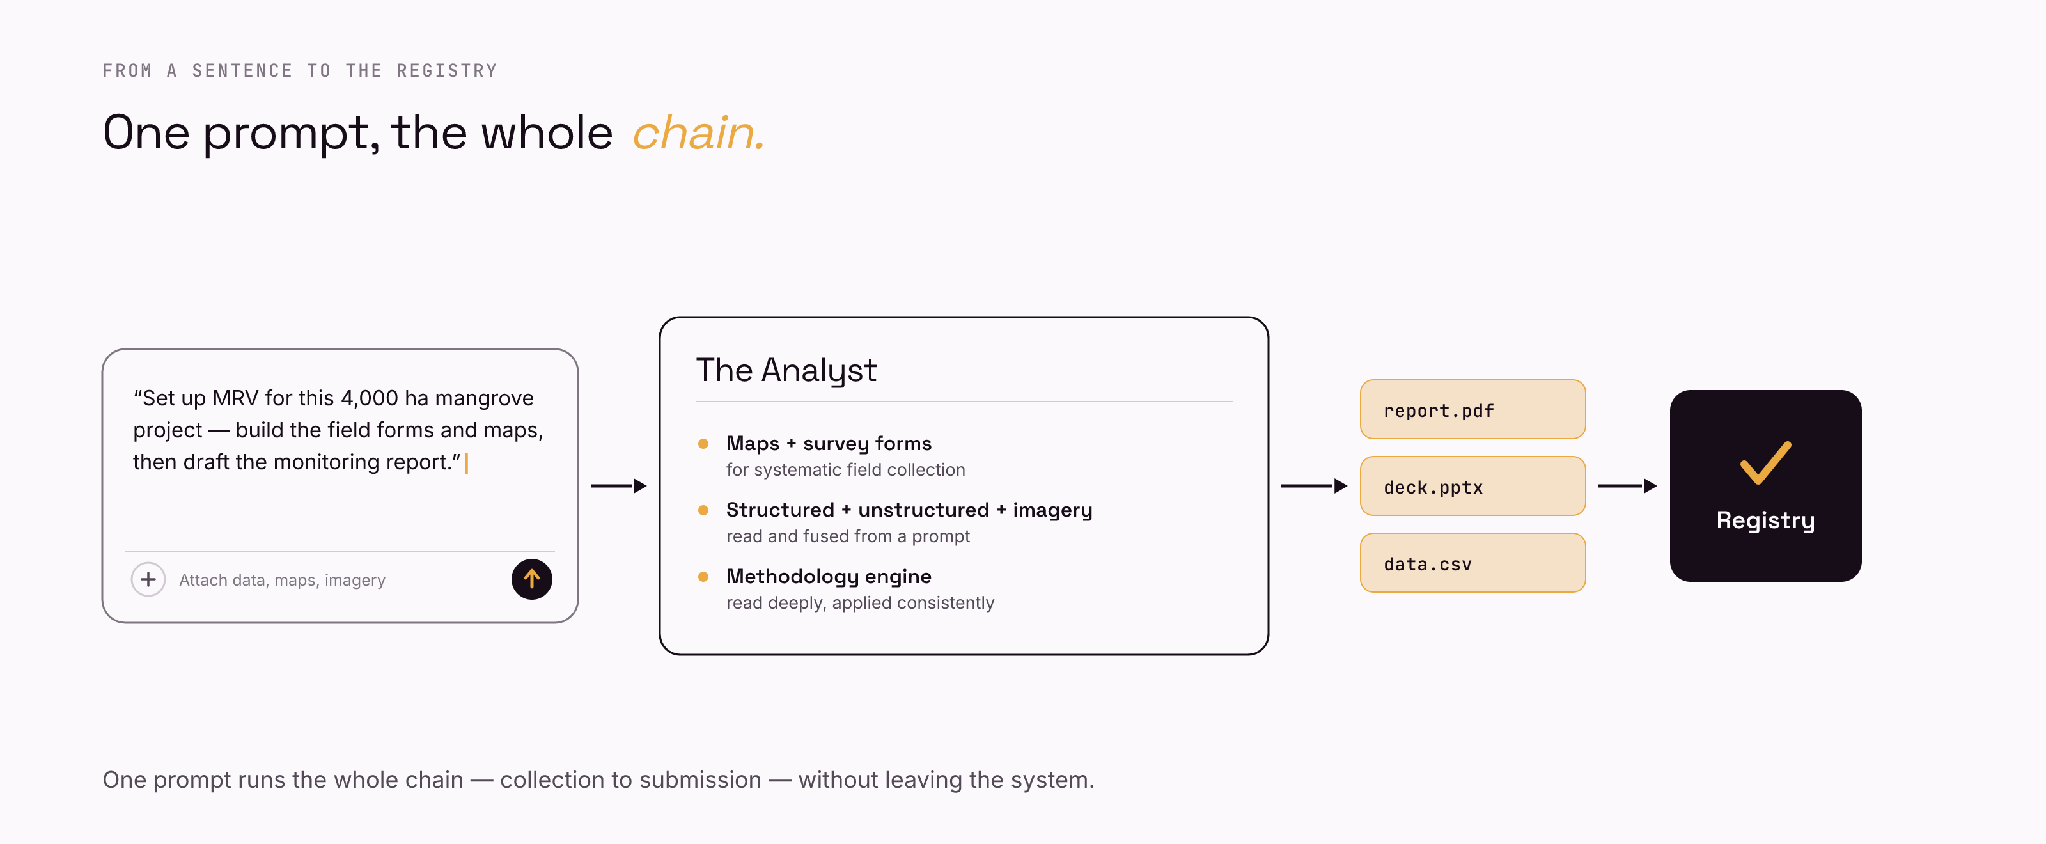
Figure 3 — From a sentence to the registry: one prompt runs the whole chain.
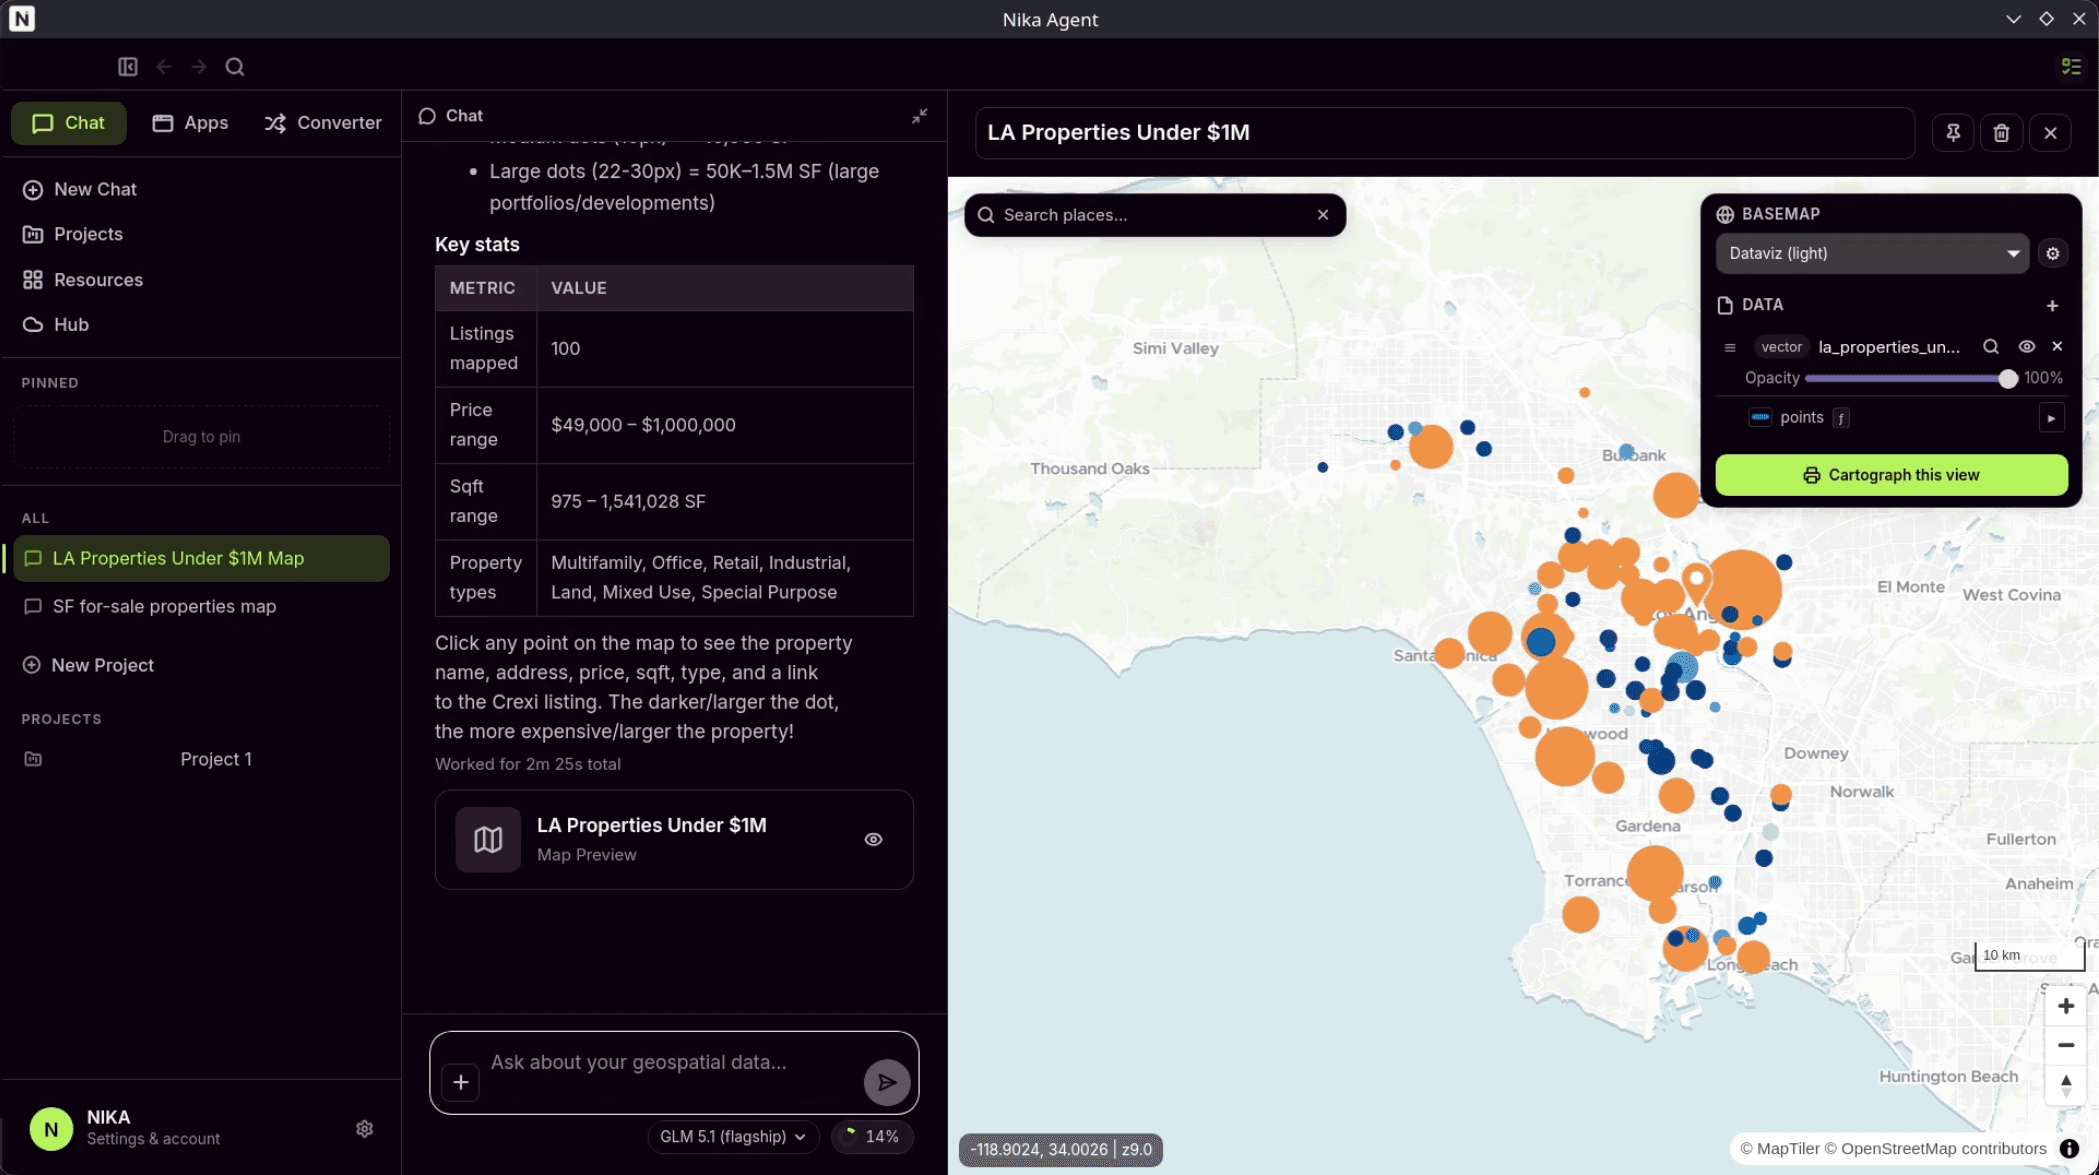
So we built it. You talk to it in plain language, and it does the work an entire afternoon of tool-switching used to demand.
It creates the maps and the survey forms for data collection, so the field team gathers structured, comparable data from day one — collection and analysis finally in the same world.
It reads structured and unstructured data and imagery from a single prompt — the DWG, the KML, the GeoJSON, the CSV, the shapefiles, the satellite tiles — and fuses the mess into one clean, coordinate-aware layer instead of a week of manual janitorial work.
It understands the methodology more completely and more consistently than a tired human can — holding the entire document in context, applying it the same way every time, surfacing the clauses that actually bind.
And it produces the PDF, the PPT, and the CSV built for reporting straight to the registry — the report you present, the deck you brief the board with, the table the registry ingests. The whole chain, from a sentence to a submission, without leaving the system.
It does everything a generic agent like ChatGPT or Claude does with text — and then keeps going, because it understands real coordinates and ties every result back to a real place on the Earth.
We call it NIKA Analyst. I have wanted this for years and assumed I would keep waiting. We have genuinely never seen a true dMRV system before this — and the people it is for, the ones quietly holding the line for the living world, did not need it next year. They needed it yesterday.
It is early days. The models will get better, the methodologies will get more digital, the verifiers will learn to trust the new evidence. But the direction is no longer in question. The future of how we measure, report, and protect nature is an AI-assisted ecosystem — one system, one context, a loop that finally closes.
The contraption served us long enough. It is time to put down the buckets.
If you are doing this work — restoring, measuring, proving it — put a real project through it: Try NIKA Analyst on your own project →
Notes & sources
Verra dMRV pilot, first credits approved (Feb 2026): Verra · Carbon Credits
Traditional MRV is resource-intensive, costly, slow; standards were not designed to be digital: Nature Tech Collective — MRV 101 · SustainCERT / World Bank dMRV
Purpose-built end-to-end platforms over fragmented tools; registry interoperability: RMI — Carbon Crediting Data Framework
Kunming–Montreal Global Biodiversity Framework (23 targets, 30x30): GBF indicators