New — VM0047
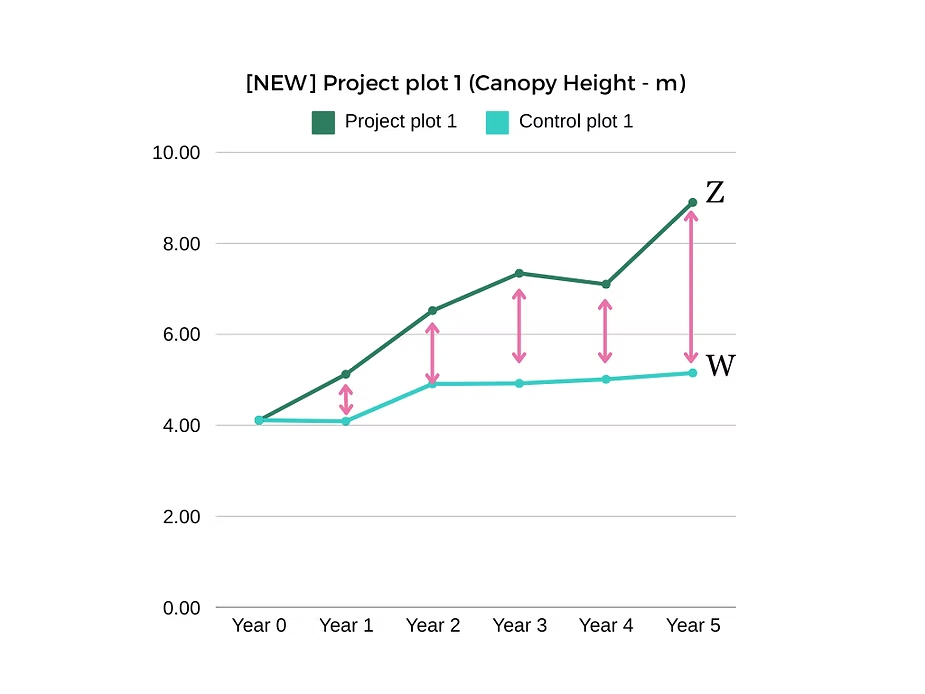
As shown in the graph below, the growth of sample plots of carbon being stored in your project area (Z) is being weighed against a proxy control plot (W). The amount of credits that the project proponent can attain is the difference between Z and W, which is recalibrated every year.
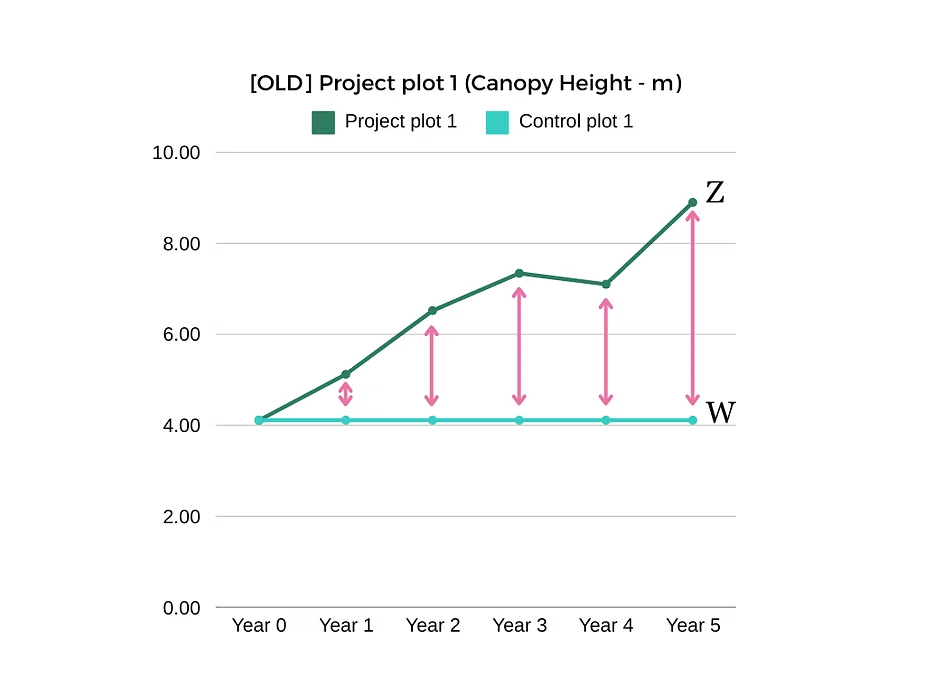
Old — AR-ACM0003, AR-AMS0007
As shown below, the growth of sample plots of carbon being stored in your project area (Z) is measured against a static baseline (W). The amount of credits that the project proponent can attain is the difference between Z and W.
So, what does this mean?
Using a more robust method leads to a much welcome increase in accuracy in carbon emission accounting. This means the next wave of afforestation projects entering the market will be of a higher quality. This will likely lead to 2 things:
- Higher quality projects = Price per tonne of CO2 reduced will increase
- Moving forward, credit issuance per project will likely decrease when compared to projects registered under the previous methodologies. In the grand scheme of the voluntary carbon markets, this is a welcome market adjustment and not a bad thing,
Reach out if you require carbon due diligence services or looking for a Technical Partner on your projects.